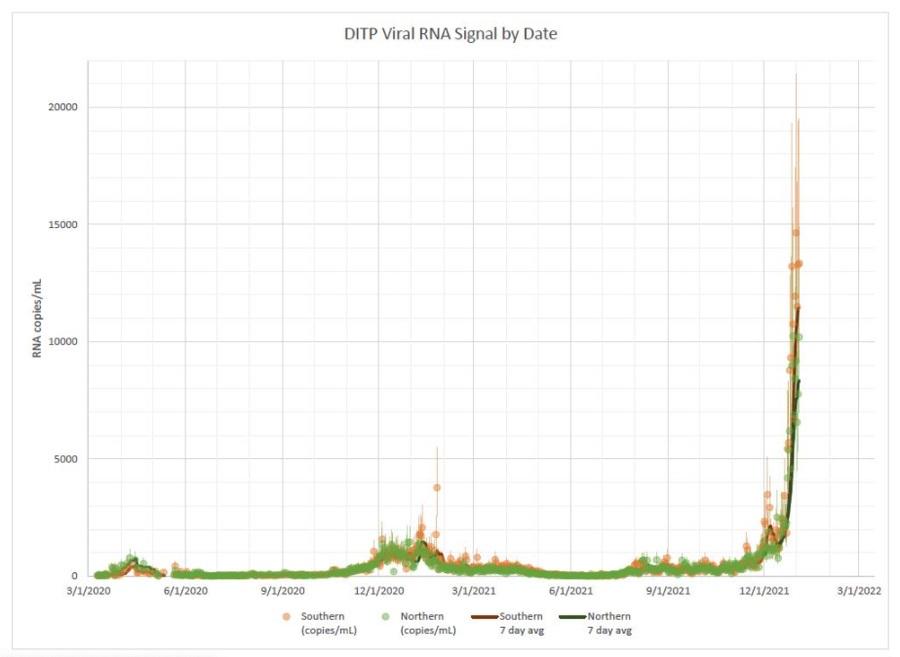
I"m curious what numbers you used. I know there are different ways to calculate this. Very early on, like in April of 2020 the per capita infections were 0.02% of the Texas population. The numbers I had then were a population of 29,360,000 and as of 4/5/2020 6,877 cases. As of yesterday, with a 2021 Texas population of 29,527,941 and total cases of 5,087,686, that yields a per capita infection of 17.2%.mayor wrote: ↑Tue Jan 11, 2022 8:43 amYep. I still have a .2% chance of getting sick with coof.philip964 wrote: ↑Mon Jan 10, 2022 4:12 pm Brief Covid- 19 Update
January 7, 2022 5:15pm (9 days) Friday 302,367,482 (+2,010,059)per 24 hr average over 9 days) cases worldwide with 5,478,105 (+6,407) dead 9,371,317,757 vaccine doses, USA 59,114,417 (+613,047) infected, 835,929 (+2,022 per day) dead .
January 10, 2022 2:21pm (3 days almost) Monday 308,619,579 (+2,084,032 per 24 hr average over 3 days an increase of 20,010 per day) cases worldwide with 5,492,243 (+4,712 a decrease of 1,695 per day) dead 9,439,843 vaccine doses, USA 60,784,265 59,114,417 (+556,616 a decrease of 56,431 per day) infected, 838,527 (+866 a decrease of 1,156 per day) dead .
So is the U. S. turning the corner with this small daily decrease in new infections and new deaths?
Of course 556,616 new daily infections is still a lot.
Of course using vaccinated numbers or numbers from some different location, maybe a small rural town or something, you can get different numbers. I know there are several different ways to look at it but I'm just curious how you got .2%?
Death rate had gotten as high as 2.7% in Texas (I know some of the counting can be in question but this si pretty much consistent globally), with Omicron, treatment improvements, vaccines etc it's dropped back down to 1.5% in Texas. Thats from the beginning. I'm sure it's much lower if you only look since Omicron.
I don't have any numbers for being sick enough to be in the hospital.
